Using vasprun as a python library
vasprun can be also used as a stand-alone library for high-throughput analysis on many calculations.
0, Load the file
To start, you can simply load the file.
from vasprun import vasprun
vasp = vasprun('vasprun.xml')
1, Parse the convergence
As long as the vasp object is created, it is advised to check the calculation is correctly done or not.
>>> vasp = vasprun('error-vasprun.xml')
>>> vasp.errormsg
'SCF is not converged'
>>> vasp.error
True
2, Extract the useful info
Then, you can retrieve many informations from vasp.values attribute. The values have a variety of formats, e.g.
incar(dict)kpoints(dict)metal(bool)gap(float)…
>>> vasp.values.keys()
dict_keys(['incar', 'kpoints', 'parameters', 'name_array', 'composition', 'elements', 'formula', 'pseudo_potential', 'potcar_symbols', 'valence', 'mass', 'calculation', 'finalpos', 'bands', 'occupy', 'metal', 'gap', 'cbm', 'vbm'])
>>> vasp.values['gap']
0
>>> vasp.values['metal']
True
>>> vasp.values['vbm']
{'kpoint': array([0.0625    , 0.08333333, 0.125     ]), 'value': 0.2801155599999996}
>>> vasp.values['cbm']
{'kpoint': array([0.4375    , 0.08333333, 0.375     ]), 'value': -0.18198443999999991}
>>> from pprint import pprint
>>> pprint(vasp.values['incar'])
{'ALGO': ' Normal',
 'EDIFF': 0.0004,
 'ENCUT': 520.0,
 'IBRION': -1,
 'ICHARG': 0,
 'ISIF': 3,
 'ISMEAR': 1,
 'ISPIN': 1,
 'LAECHG': False,
 'LCHARG': True,
 'LELF': True,
 'LORBIT': False,
 'LREAL': ' Auto',
 'LVHAR': False,
 'LWAVE': True,
 'NELM': 100,
 'NSW': 0,
 'PREC': 'accurate',
 'SIGMA': 0.05}
According to the vasp’s arrangements, most of the calculation results shoud be found in values[‘calculation’] dict.
>>> vasp.values['calculation'].keys()
dict_keys(['stress', 'efermi', 'force', 'eband_eigenvalues', 'energy', 'tdos', 'pdos', 'projected', 'born_charges', 'hessian', 'normal_modes_eigenvalues', 'normal_modes_eigenvectors', 'epsilon_ion', 'pion', 'psp1', 'psp2', 'pelc', 'energy_per_atom'])
3, useful functions
vasp = vasprun('vasprun-band.xml')
vasp.plot_band(filename='band1.png')
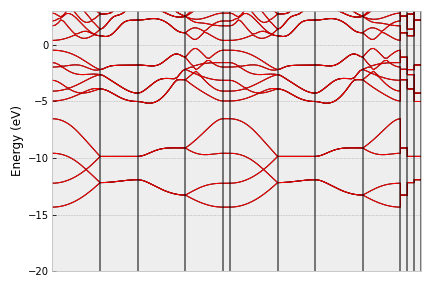
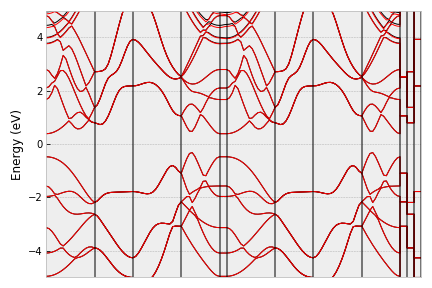
If you want to adjust the range of energy, just use the ylim parameter,
vasp.plot_band(filename='band2.png', ylim=[-5,5])
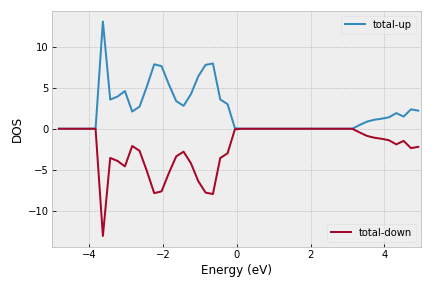
vasp.plot_dos(filename='dos1.png', ylim=[-5,5])
2024/06/07: Below is another example to plot the combined band/DOS from the scratch.
from vasprun import vasprun
vasp = vasprun('data/vasprun.xml-band')
vasp.plot_band_dos(filename='band_dos.png', ylim=[-5,5])
